Technology
Enhance Your Skills: Top Excel Data Visualization Courses for 2025

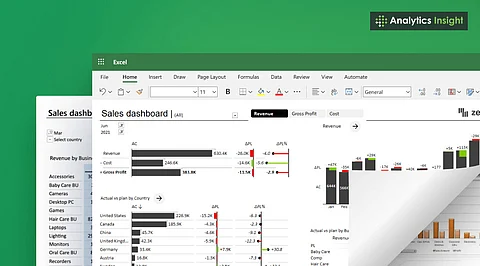
Online learning platforms are stepping up to meet the growing demand for data visualization skills, particularly in **Microsoft Excel**. As of 2025, several courses stand out for their ability to teach users—from beginners to advanced learners—how to transform raw data into compelling visual narratives. This skill set is increasingly important in various sectors, including business and analytics.
Popular Courses for Every Skill Level
One of the most recognized platforms, **Udemy**, features a course led by **Chris Dutton** and **Maven Analytics**. This comprehensive program covers over **20 types of charts** and teaches learners how to create dashboards that update automatically. Real-world examples enhance its practicality, making it suitable for both workplace and academic applications. The course has received strong reviews and continues to be a top choice.
Another notable course is offered by **Macquarie University** on **Coursera**. This specialization begins with foundational Excel skills and progresses into advanced topics such as **pivot tables**, **dashboard design**, and **data cleaning**. Each module includes projects that simulate real workplace challenges, providing valuable experience for students pursuing careers in business or analytics.
For those seeking a focused approach, **DataCamp** provides a short, project-based course entirely dedicated to creating visuals. Learners engage in interactive lessons that guide them through building and customizing charts step by step. This format is particularly beneficial for individuals with limited time, as the course is designed to fit easily into busy schedules.
Advanced Techniques and Professional Skills
Another offering from **Udemy** caters to learners interested in diverse visual techniques. This course delves into advanced visuals, including **tornado charts**, **Gantt charts**, and **dynamic infographics**. Practice projects encourage creative thinking about data presentation, making it an excellent resource for anyone looking to enhance their visual communication skills.
**LinkedIn Learning** focuses specifically on dashboard creation. This course covers essential topics such as **conditional formatting**, layout design, and interactive tools like **slicers**. Completing the course allows learners to add a certificate directly to their LinkedIn profiles, which can increase their appeal to potential employers.
In partnership with **Rice University**, **edX** offers a professional certificate that encompasses data analysis and visualization. Participants learn to utilize pivot tables and present results through various charts and dashboards. The academic approach is ideal for those who prefer a structured learning environment similar to traditional university courses.
Additionally, **Coursera** features another course from **Macquarie University** that is part of the “Excel Skills for Business” series. This program dives into advanced features such as automation and complex formulas, equipping learners with skills that combine analysis with visualization, crucial for business applications.
**GoSkills** rounds out the offerings with short, modular lessons focused on professional dashboards. This course teaches users how to design clean and interactive visuals, making it a suitable option for those with hectic schedules. Certificates are included, adding further value.
Excel has evolved beyond merely organizing data into rows and columns. Effective charts and dashboards clarify data meanings and reveal trends or issues that raw numbers might obscure. Professionals in fields such as finance, marketing, research, and sports increasingly seek individuals who can articulate data insights clearly.
The variety of Excel data visualization courses available in 2025 highlights the rising importance of these skills. Platforms like **Udemy** and **Coursera** provide structured paths for learners at different levels, while **DataCamp** and **GoSkills** emphasize short, practical lessons. **LinkedIn Learning** and **edX** offer professional and academic perspectives, respectively. Together, these courses cover essential skills, from basic chart design to advanced dashboard creation, making them excellent starting points for those looking to enhance their data presentation capabilities this year.
-

 Technology5 months ago
Discover the Top 10 Calorie Counting Apps of 2025
-

 Technology3 weeks ago
OpenAI to Implement Age Verification for ChatGPT by December 2025
-

 Health3 months ago
Bella Hadid Shares Health Update After Treatment for Lyme Disease
-

 Health3 months ago
Analysts Project Stronger Growth for Apple’s iPhone 17 Lineup
-

 Health3 months ago
Erin Bates Shares Recovery Update Following Sepsis Complications
-

 Technology5 months ago
Discover How to Reverse Image Search Using ChatGPT Effortlessly
-

 Technology3 months ago
Electric Moto Influencer Surronster Arrested in Tijuana
-

 Technology2 months ago
Discover 2025’s Top GPUs for Exceptional 4K Gaming Performance
-

 Technology5 months ago
Meta Initiates $60B AI Data Center Expansion, Starting in Ohio
-

 Technology5 months ago
Recovering a Suspended TikTok Account: A Step-by-Step Guide
-

 Health5 months ago
Tested: Rab Firewall Mountain Jacket Survives Harsh Conditions
-

 Lifestyle5 months ago
Belton Family Reunites After Daughter Survives Hill Country Floods


